Writing clean, error-free JavaScript code is essential for building reliable applications. This lesson covers practical debugging techniques and best practices to maintain high code quality.
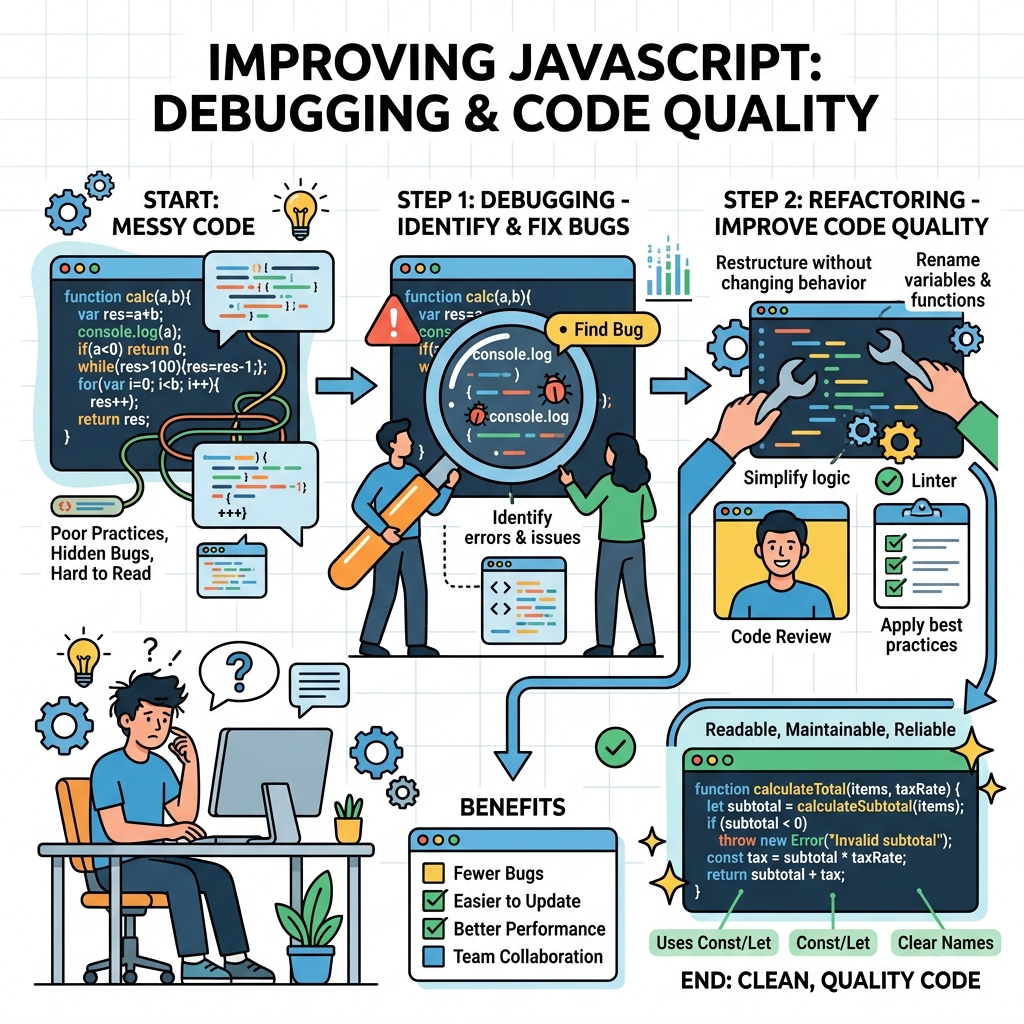
Common Debugging Techniques
- Console Logging: Use
console.log()to inspect variables, outputs, and program flow. - Debugger Statement: Insert
debugger;to pause execution and inspect in browser dev tools. - Browser DevTools: Utilize breakpoints, step execution, watch variables, and inspect call stacks.
- Error Messages: Read stack traces carefully to locate the source of errors.
📌 Deep Dive: Using console.log() Effectively
// Check value and type of variable 'count'
const count = 10;
console.log('Count value:', count);
console.log('Count type:', typeof count);
Count type: number
Best Practices for Code Quality
- Consistent Naming: Use meaningful and consistent variable/function names.
- Modular Code: Break code into small reusable functions.
- Comments: Add comments to clarify complex logic but avoid obvious statements.
- Linting: Use tools like ESLint to catch syntax and style issues early.
- Code Formatting: Maintain consistent indentation and spacing using Prettier or editor configs.
Debugging vs. Code Quality
| Aspect | Goal |
|---|---|
| Debugging | Identify and fix existing errors and unexpected behavior. |
| Code Quality | Write maintainable, clear, and efficient code to prevent bugs. |
💡 Debugging Tip
Start debugging by isolating the problem with small test cases and incrementally add complexity as the code proves correct.
⚠️ Avoid Excessive Logging
Remove or comment out console.log() statements in production code to prevent performance issues and leaking sensitive information.
Common Debugging Tools in Browsers
- Chrome DevTools: Access via F12 or right-click → Inspect. Features include breakpoints, call stack, and live editing.
- Firefox Developer Tools: Similar features with unique performance and accessibility inspectors.
- VS Code Debugger: Debug Node.js code directly from the editor with breakpoints and variable watches.
💡 Maintaining Code Quality
Regularly review your code through peer reviews or using automated tools to catch quality issues early in the development cycle.
📌 Deep Dive: Using Breakpoints to Debug
function calculateArea(width, height) {
  debugger; // Execution will pause here
  return width * height;
}

const area = calculateArea(5, 4);
console.log(area);
Quick Knowledge Check
Test what you just learned
Question 1 of 2
Which tool allows you to pause JavaScript execution and inspect variables step-by-step?
Question 2 of 2
What is a key benefit of writing modular code?
Loading results...