Browser Developer Tools (DevTools) are built-in utilities in modern browsers that help developers inspect, debug, and optimize web pages. They provide real-time access to the HTML, CSS, JavaScript, network activity, performance metrics, and more.
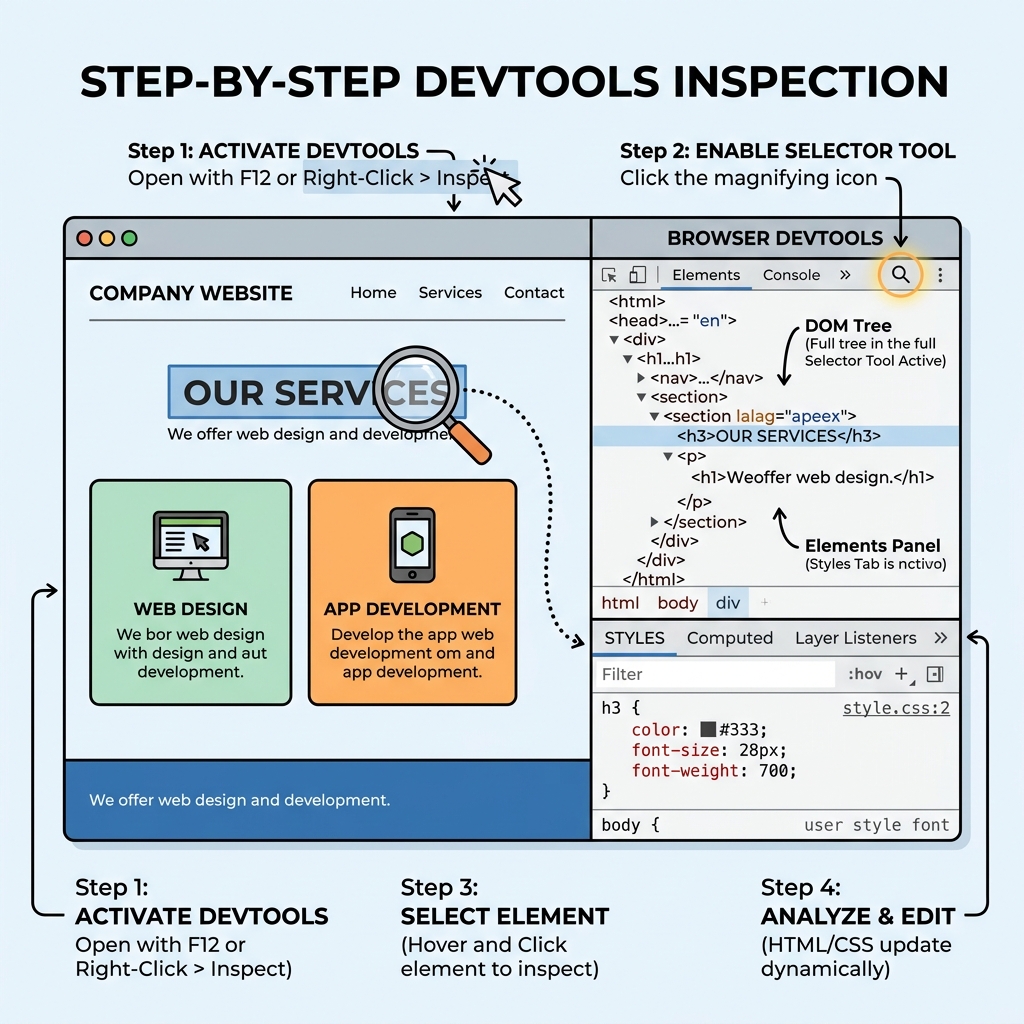
How to Open DevTools
- Press F12 or Ctrl+Shift+I (Windows/Linux) or Cmd+Option+I (Mac).
- Right-click any element on the page and select Inspect or Inspect Element.
- Use the browser menu: More tools → Developer tools.
Main Panels in DevTools
| Panel | Purpose |
|---|---|
| Elements | Inspect and modify HTML and CSS live on the page. |
| Console | View logs, run JavaScript commands, and see errors. |
| Sources | Debug JavaScript via breakpoints and step-through code. |
| Network | Monitor resource loading, request/response headers, and timings. |
| Performance | Analyze page loading speed and runtime performance. |
| Application | Inspect storage, cookies, local/session storage, and service workers. |
| Security | Check security details like HTTPS certificates and mixed content. |
Key Features for Beginners
- Inspect Elements: Click on the element selector icon (cursor) to select elements on the page and view their HTML and CSS.
- Edit HTML/CSS: Double-click HTML attributes or CSS properties to edit them live and see immediate results.
- Console Logging: Use
console.log()in your scripts and view output/errors in the Console panel. - JavaScript Debugging: Set breakpoints in the Sources panel to pause execution and inspect variables.
- Network Monitoring: Reload the page with DevTools open to see all requests, their status, sizes, and load times.
💡 Live Editing
Any changes made in the Elements or Styles panel affect only the current page state. Reloading the page will reset changes unless saved in source files or overrides.
Using the Console Effectively
The Console panel allows you to run JavaScript commands directly on the page context. Try these to interact with the page:
document.querySelector('selector')— Select an element.console.log('Hello, DevTools!')— Print messages to the console.debug(functionName)— Automatically break when a function is called.
💡 Console Shortcuts
Use ↑ and ↓ to cycle through previous commands. Press Tab for autocomplete suggestions.
Inspecting Network Requests
The Network panel records all resource requests made by the page. Key columns include:
- Name: Resource filename or URL.
- Status: HTTP status code.
- Type: Resource type (document, script, stylesheet, image, xhr, etc.).
- Size: Transferred data size.
- Time: Duration to load the resource.
Filtering by type or searching helps isolate specific requests, useful when debugging APIs or asset loading issues.
Setting Breakpoints in JavaScript
In the Sources panel, you can pause JavaScript execution at specific lines or events to inspect state:
- Open the JavaScript file from the file navigator.
- Click the line number to add a breakpoint.
- Reload the page or trigger the event to hit the breakpoint.
- Use the debugging toolbar to step through code and examine variables.
⚠️ Source Maps
If your JavaScript is minified or compiled (e.g., from TypeScript), enable source maps to debug original source code.
📌 Deep Dive: Using Console to Inspect Elements
const header = document.querySelector('h1');
console.log(header.textContent);
header.style.color = 'blue';💡 Pro Tip
DevTools settings can be customized for themes, shortcuts, and experiments. Explore the gear icon or settings menu inside DevTools.
Quick Knowledge Check
Test what you just learned
Question 1 of 2
Which DevTools panel would you use to monitor all HTTP requests made by a webpage?
Question 2 of 2
How can you pause JavaScript execution at a specific line of code?
Loading results...